Pillar handbook
How to Size a Wheat Flour Mill: The Complete Engineering Method
A step-by-step method for sizing a wheat flour milling plant — from demand analysis and extraction rate through flow sheet passages, sifter area, power budget and building dimensions. Includes worked examples for 20, 60 and 200 t/d plants.
Key takeaways
- Size from finished flour demand backwards, not from wheat intake forwards — the difference between 72% and 78% extraction is 8% of your wheat bill.
- Sifter area is the binding constraint in most flow sheets: allow 1 m² per 0.8 t of daily capacity for a 4B5M layout.
- Power consumption per tonne falls from ~72 kWh at 60 t/d to ~67 kWh at 500 t/d; at 300 t/d that gap is worth roughly 500,000 kWh a year.
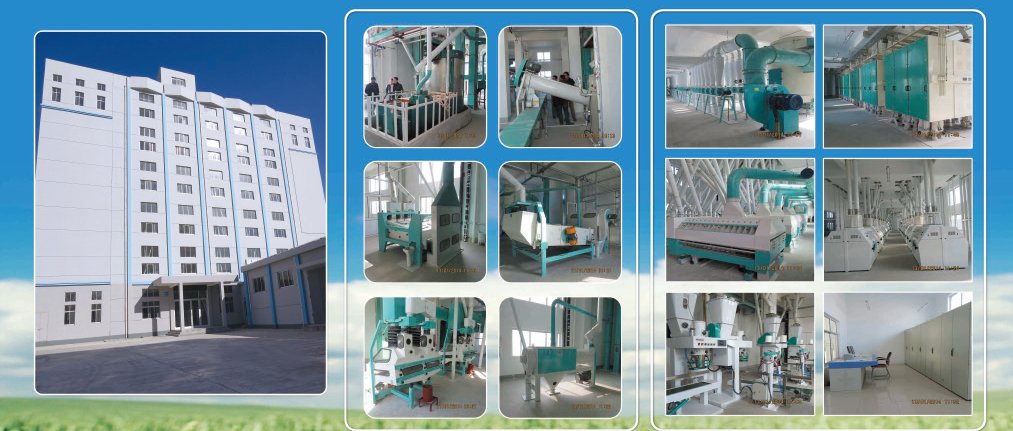
- A 30 t/d plant needs 18 × 6 × 6.5 m and 92 kW; a 200 t/d plant needs 50 × 7.5 × 22.5 m and 690 kW. Those numbers decide the building before the machines.
Sizing a flour mill is an exercise in working backwards. Almost every failed project we are asked to rescue was sized forwards — someone decided to buy a 30 t/d plant, built a building around it, and only later worked out that the local market could absorb 12 t of flour a day.
The method below is the one we use on every enquiry. It has five stages, and each stage constrains the next.
Stage 1 — Establish finished flour demand, not wheat intake
The first number you need is not tonnage. It is bags sold per day, by grade.
Write it down like this:
| Grade | Bag size | Bags/day | Tonnes/day | Price/t |
|---|---|---|---|---|
| Patent / special grade 1 | 25 kg | 300 | 7.5 | reference |
| Standard / grade 2 | 50 kg | 140 | 7.0 | −12% |
| Bran (by-product) | 50 kg | 120 | 6.0 | −70% |
This table does three things at once. It gives you total flour output (14.5 t/day), it gives you the product mix that determines how many passages and sifter compartments you need, and it gives you the revenue structure that determines whether the plant can service its capital.
Most feasibility studies skip this and go straight to “we want a 30-ton plant”. That is buying a machine before knowing the job.
Stage 2 — Convert flour demand into wheat intake
Extraction rate is the ratio of flour produced to wheat milled. It is the single most economically important number in the plant, because wheat is 65–80% of your cost base.
| Product | Typical extraction | Wheat needed per tonne of flour |
|---|---|---|
| Patent flour only | 65–72% | 1.39–1.54 t |
| Patent + standard (2 grades) | 75–78% | 1.28–1.33 t |
| Atta / whole wheat | 85–92% | 1.09–1.18 t |
| Maida (South Asian) | 72–76% | 1.32–1.39 t |
At 14.5 t of flour per day and 76% extraction, you need 19.1 t of wheat per day. Add 8% for cleaning losses, moisture shrinkage in tempering and spillage: 20.6 t/day.
Now add headroom. A plant that runs at 100% of design capacity every day has no maintenance window and no ability to catch up after a breakdown. Design for 85–90% utilisation:
20.6 ÷ 0.87 ≈ 23.7 t/day → specify a 25 t/d plant.
This is why so many buyers end up on the 6FTDP-25 rather than the 20. They started with a “20 t/d requirement” and the arithmetic moved them one step.
Assumptions matter here. If your wheat is dirty (2.5% impurity instead of 1%), cleaning losses double and you need a bigger intake for the same output. If your wheat is dry (10.5% moisture instead of 12.5%), you lose less in tempering but the bran is more brittle and extraction drops. Both effects are real and both are usually ignored at the enquiry stage.
Stage 3 — Choose the flow sheet, which sets the passage count
The flow sheet is the diagram of how wheat becomes flour. Its notation is compact: 3B2M means three break passages and two reduction passages.
| Flow sheet | Minimum capacity | Grades produced | Purifier | Typical extraction |
|---|---|---|---|---|
| 3B2M | 15 t/d | 1–2 | No | 72–74% |
| 3B3M | 25 t/d | 2 | No | 74–76% |
| 3B4M1S | 40 t/d | 3 | Yes (1 unit) | 75–77% |
| 4B5M1S1T | 60 t/d | 3–4 | Yes (bank) | 76–79% |
| 5B7M2S2T | 100 t/d+ | 4+ | Yes (bank) | 77–80% |
B = break, M = reduction, S = scratch/sizing, T = tailing.
Here is the rule that matters: you cannot reach a given extraction with too few passages. Each additional break passage scrapes a little more endosperm off the bran. Each additional reduction passage grinds that endosperm a little finer. Stop too early and you leave flour on the bran, which goes out the door as low-value by-product.
A 3B2M plant physically cannot exceed about 74% extraction no matter how it is operated. If your business plan assumes 78%, you need 4B4M and a purifier. This is the most common arithmetic error in small-mill feasibility.
Stage 4 — Size the sifting area, which usually binds
Sifting area is the constraint that surprises people, because it is invisible on a price list. Sifters are expensive and large, and under-sizing them produces a plant that grinds fine but cannot classify.
The working rule for a standard flow sheet:
Sifting area (m²) = daily capacity (t/d) ÷ 0.8
So:
| Capacity | Sifter area needed | Typical configuration |
|---|---|---|
| 20 t/d | 25 m² | 2 × twin-bin plansifter (5 m² each bin) |
| 30 t/d | 37.5 m² | 2 × twin-bin, or 1 high square FSFG4×24 |
| 60 t/d | 75 m² | 2 × FSFG6×24 (39.5 m² each) |
| 100 t/d | 125 m² | FSFG8×24 + FSFG6×24, or 3 × FSFG6×24 |
| 200 t/d | 250 m² | Bank of 4–5 high square units |
| 300 t/d | 375 m² | Bank of 7–8 high square units |
The rule assumes a standard 4B5M flow sheet. If your flow sheet has more passages, you need more sifting area. If you are making a single whole wheat product with no grading, you need much less.
Stage 5 — Set the power budget and the building envelope
Power and building dimensions both flow directly from capacity, and both are published in our plant tables because they are the two numbers that block a project at the planning-permission stage rather than the purchase stage.
| Capacity | Installed power | kWh per tonne flour | Building (L × W × H) |
|---|---|---|---|
| 30 t/d | 92 kW | 70–74 | 18 × 6 × 6.5 m |
| 60 t/d | 150 kW | 70–74 | 24 × 8 × 8 m |
| 100 t/d | 308 kW | 70–74 | 35 × 7.5 × 18.5 m |
| 200 t/d | 690 kW | 65–71 | 50 × 7.5 × 22.5 m |
| 300 t/d | 920 kW | 65–71 | 60 × 11 × 27.5 m |
| 500 t/d | 1,650 kW | 65–70 | 55 × 17 × 27.5 m |
Two observations that are worth more than the table.
First, specific power falls with scale. The gap between 74 and 65 kWh/t looks small until you multiply it. A 300 t/d plant running 330 days consumes 300 × 330 × 7 = 693,000 kWh a year more if it operates at 72 instead of 65 kWh/t. At USD 0.10/kWh that is USD 69,300 per year, every year, for the life of the plant. Scale is not just about labour.
Second, height is the expensive dimension. Going from 8 m to 18.5 m roughly doubles civil cost per square metre. This is why the 20–30 t/d class uses floor-mounted plansifters — it keeps the building cheap. Above 60 t/d the gravity flow advantage of a tower pays for the structure within a few years of reduced pneumatic conveying power.
Worked example — a 60 t/d plant in East Africa
A buyer has a wheat supply contract and a market for two flour grades.
- Demand: 45 t/day of patent flour, 15 t/day of standard flour. Total 60 t/day.
- Extraction: 78% at two grades. Wheat needed = 60 ÷ 0.78 = 76.9 t/day. Plus 6% losses = 81.5 t/day.
- Flow sheet: 4B5M1S1T with two high square plansifters and a purifier bank. This is the minimum that reaches 78%.
- Sifter area: 60 ÷ 0.8 = 75 m². Two FSFG6×24 units give 79 m². Correct.
- Power: 150 kW installed, 72 kWh/t. Daily consumption 4,320 kWh.
- Building: 24 × 8 × 8 m, storey-typed with two floors.
The entire sizing exercise took six numbers. The rest of the project — civil design, electrical, erection sequencing — is engineering labour, but it is labour applied to a correctly specified target.
Where sizing goes wrong
Four failure modes, in order of frequency:
Sizing to peak demand instead of average. A mill that sells 20 t/day in December and 8 t/day in June should not buy a 20 t/d plant. It should buy 12 t/d and run an extra shift in December.
Ignoring wheat variability. A plant specified for 12.5% moisture hard wheat will underperform on 10.5% soft wheat. Specify the worst wheat you will actually buy, not the best.
Under-sizing sifting to save capital. Sifter cost is roughly 12–18% of plant cost. Cutting it by a third saves 4–6% of capex and costs 3–5 points of extraction forever.
Forgetting the by-product. Bran is 22–28% of intake and it has to go somewhere — storage, bagging, transport. A 60 t/d plant produces 18 t/day of bran, which needs a silo or a very reliable buyer.
What to send us
If you want a flow sheet rather than a brochure, send:
- Target flour output per day, by grade
- Wheat type, origin and typical analysis (moisture, protein, ash, impurity)
- Available building footprint and height, or confirmation that a new building is possible
- Local power supply: voltage, phases, available kVA
- Water availability and effluent constraints
- Labour availability and skill level
- Budget range and financing structure
With those seven items we can produce a preliminary flow sheet, equipment list and budget range in 12 working hours. Without them, any quotation you receive is a guess dressed as a price.
Articles in this handbook
- → Flour Mill Capacity Calculation: From Demand to Tonnage in Four Steps
- → Flour Mill Building Requirements: Height, Loading, Floors and Layout
- → Flour Mill Layout Design: Workflow, Access and the Cost of Bad Geometry
- → Flour Mill Power Consumption: What kWh per Tonne Really Means
- → How Does a Flour Mill Work? From Wheat Kernel to Flour Bag